
A speed test measures one page load, from one location, at one moment. The Chrome User Experience Report (CrUX) measures what real Chrome visitors experienced across a whole month. The CrUX Dashboard puts that data into a free report, and it is the most reliable way we know to see whether a change on your site, including a move to new hosting, made a difference for actual visitors.
Update: Google has since deprecated the Looker Studio CrUX Dashboard shown in the video. The same real-user data now lives in CrUX Vis, which updates weekly instead of monthly and shows URL-level data where Chrome has enough of it. The reading of the numbers described below is unchanged.
Which metrics the server affects
The report has a tab per metric, each with a month-by-month history and a filter for phone or desktop. Not every metric is a hosting question, so it helps to know which ones are.
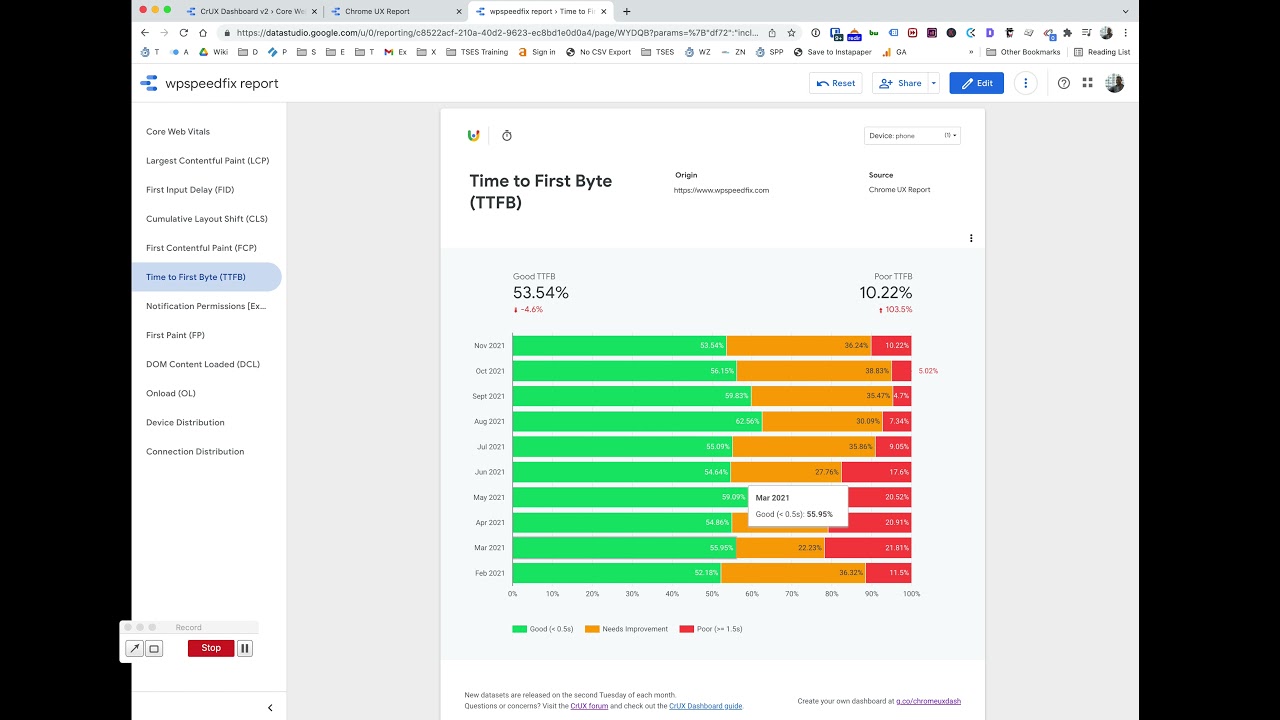
- Time to First Byte (TTFB): how long the browser waits for the first byte of the page. This is the metric the server and page caching influence most directly. The video treats under half a second as the goal.
- First Contentful Paint (FCP): when something first appears on screen. Green is under 1.8 seconds. TTFB is part of it, but so are the theme, fonts and scripts.
- The Core Web Vitals (Largest Contentful Paint, Interaction to Next Paint and Cumulative Layout Shift): mostly decided by the theme, plugins, images and scripts. A responsive server helps Largest Contentful Paint, but it cannot make a heavy page light.
- Onload and device breakdown: the traditional load time, and how your visitors split between phone and desktop.
Creating the report
The video shows two methods, and the links for both are in the video description.
- The quick launcher. Enter your site address and press enter. It builds the report in about ten seconds, but you cannot edit much of it or embed it.
- Google’s CrUX Dashboard connector. Enter the address, click Connect, then Create report. This version can be renamed, shared and scheduled to arrive by email, which is handy if someone else in your business wants to keep an eye on it.
Both produce a Data Studio report (the product is now called Looker Studio) that refreshes itself as new data is released. The connector version can also be edited afterwards, including the address it reports on.
Two common snags: hostname and traffic
The address you enter must match the site’s primary address exactly, including https and whether it uses www. If your site redirects from one version to the other, use the one visitors end up on.
CrUX also needs enough Chrome visitors before it publishes anything. A new domain will show no data. If the hostname changed recently, for example switching from a non-www to a www address during a migration, the new hostname may not have enough data yet. On lower-traffic sites, individual months can be missing from the charts for the same reason.
Take a baseline before you change anything
New CrUX data is released on the second Tuesday of each month, sometimes a little later, so results trail any change by weeks. Set the dashboard up before you:
- move the site to WP Alpha hosting,
- switch caching or optimisation plugins, or trial a service such as NitroPack,
- change your theme or page builder.
Write down the date of the change. When the following months arrive you can compare before and after in the same report, rather than relying on memory or a single test run on the day.
The dashboard works for any site with enough traffic, not only yours. Running it for a similar site in your industry gives you a useful reference point when deciding whether your own numbers are worth acting on.
When to open a ticket
If TTFB is the metric in the red, or it got worse after something changed on the hosting side, open a ticket from the client area and include:
- the site address and whether you were looking at phone or desktop,
- the month TTFB changed, and anything that changed on the site around then,
- whether the site runs through Cloudflare or another CDN.
Field TTFB includes each visitor’s own connection and their distance from the server, so our team starts with server response times and whether page caching is working. If the poor metric is Largest Contentful Paint, Interaction to Next Paint or Cumulative Layout Shift instead, the cause is more likely to be in the theme, plugins or page content, and we can point you towards where to look.