
There are dozens of speed test tools and they rarely agree with each other. Run the same WordPress site through three of them and you can get three different scores, which makes it hard to know whether your site is actually fast or not.
This guide covers the eight ways we test WordPress speed, what each one is good for, and the one set of numbers that matters more than any score: Core Web Vitals from real visitors.
Lab data vs real visitor data
Before the list, one idea that makes every tool easier to understand. Speed tests come in two kinds:
- Lab data is a single test run by a tool, from one location, on one simulated device. It’s instant and great for troubleshooting, but it’s a snapshot. Change the location or run it again and the number moves.
- Field data (also called real user data) is collected from real people visiting your site in real browsers. It’s what Google uses to judge your site’s Core Web Vitals, so it’s what counts for SEO.
Use lab tests to find and fix problems. Use field data to prove the fix worked.
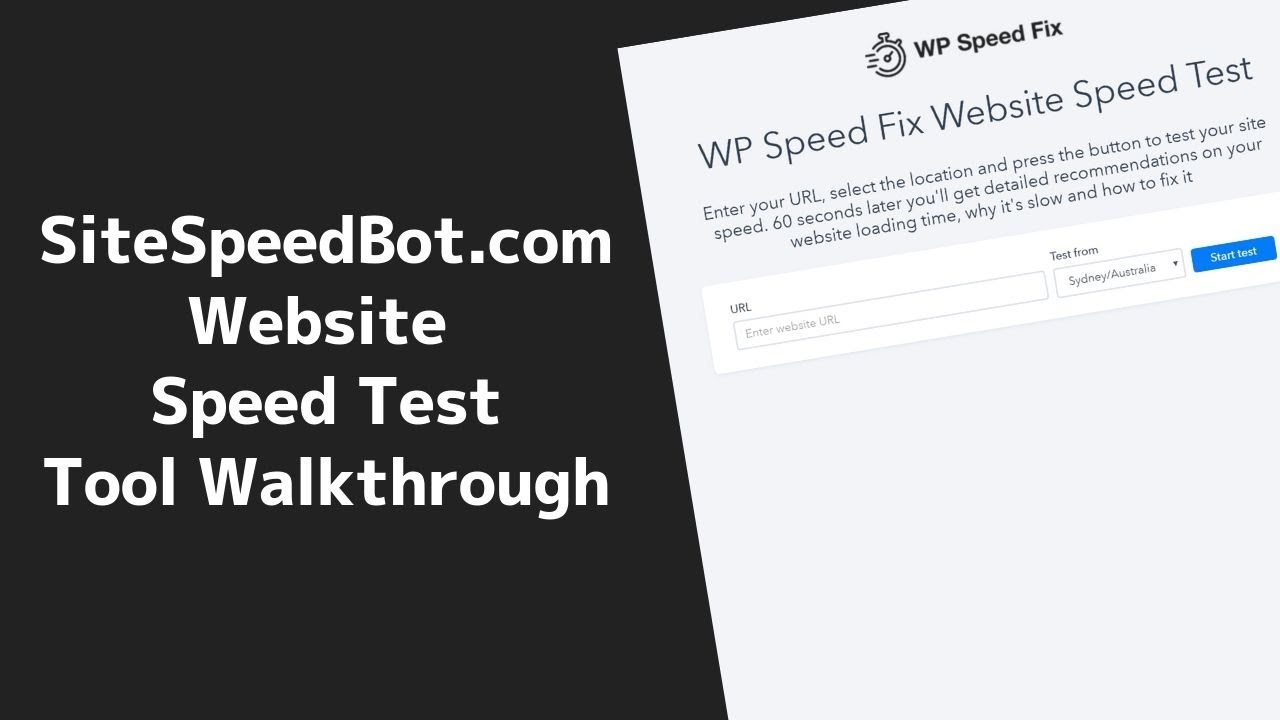
1. Our free WordPress speed test
Start with our free WordPress speed test. It loads your page in a real Chrome browser from one of 18 locations around the world (Sydney, London, Los Angeles, Virginia, Toronto, Frankfurt, Singapore, Mumbai and more), so you see how the site loads for customers in that country.
Unlike most tools, it isn’t a wrapper around Google PageSpeed Insights. The recommendations come from a WordPress-specific rules engine built from optimizing thousands of WordPress sites, so it flags things like slow hosting, admin-ajax overload, missing lazy loading and heavy plugins, then tells you how to fix them. Each report includes:
- A Core Web Vitals pass or fail verdict using Google’s real visitor data, where your site has enough traffic
- The top three fixes, in plain English
- Lab metrics (LCP, TBT, CLS, FCP, TTFB and page weight)
- A full waterfall of every file the page loads, sortable and filterable
- An SEO check showing how the page looks in Google and when shared on social media
- A shareable link, plus 12 months of test history for your domain
It’s free, needs no email address and takes about 90 seconds. Run two or three tests and compare, as one test on its own can be thrown off by a cold cache.
2. A Core Web Vitals report: the numbers that actually matter
Core Web Vitals are the three speed and experience metrics Google uses as a ranking signal. They’re measured from real Chrome users visiting your site, and Google judges each one at the 75th percentile, so three out of four visits need to hit the target:
- Largest Contentful Paint (LCP): how long until the main content (usually the hero image or heading) appears. Good is 2.5 seconds or less.
- Interaction to Next Paint (INP): how quickly the page responds when someone clicks, taps or types. Good is 200 milliseconds or less. INP replaced First Input Delay in March 2024.
- Cumulative Layout Shift (CLS): how much the page jumps around while it loads. Good is 0.1 or less.
Pass all three and you pass the Core Web Vitals assessment. This is the result to care about. A PageSpeed score of 60 on a site that passes Core Web Vitals is a far better position than a score of 95 on a site that fails, because the first is fast for real people and the second only looks fast in a lab.
The quickest way to check is our free Core Web Vitals report. Enter your domain and it pulls Google’s Chrome UX Report (CrUX) data for your whole site and your homepage, showing up to 40 weeks of LCP, INP and CLS history, split by mobile and desktop. You can also have it emailed to you weekly or monthly, so you’ll know when something changes before your rankings do.
Not enough traffic? CrUX only reports on sites and pages with enough Chrome visitors. If a report comes back empty, the site is below that threshold. Rely on lab tests, or use real user monitoring (options 6 and 7 below), which works at any traffic level.
3. Google Search Console: Google’s own Core Web Vitals report
Google Search Console is free, and if you run a website you should have it set up. Its Core Web Vitals report (under Experience in the left menu) uses the same real visitor CrUX data, but shows it the way Google sees your site: every page sorted into Good, Needs improvement or Poor, with separate reports for mobile and desktop.
What makes it different from the other tools here:
- It groups similar pages together. Instead of testing one URL at a time, Search Console groups pages with a similar experience (for example all your blog posts, or all your product pages) and tells you which groups are failing and on which metric. It’s the quickest way to find a whole section of the site with a problem.
- It names the issue, such as “LCP issue: longer than 2.5s (mobile)”, with example URLs you can then run through a lab test to find the cause.
- It tracks your fix. Once you’ve fixed an issue, click Validate Fix and Google monitors those pages over the next 28 days to confirm they now pass.
Two things to keep in mind. The data is a 28-day rolling average, so it’s slow to react: a fix you made today won’t fully show for about four weeks. Pages without enough traffic are folded into a wider group or left out, so smaller sites may see little or no data here. Page-level tools such as Vital Signs Tracker (option 7) fill that gap.
4. CrUX Vis: the detailed view of Google’s data
CrUX Vis is Google’s own tool for exploring Chrome UX Report data, and it replaced the old CrUX Dashboard in Looker Studio. It’s more technical than a Core Web Vitals report, but it goes deeper:
- Weekly trends over time for an origin (your whole site) or an individual URL
- Separate views for phone, desktop and tablet
- The spread of good, needs improvement and poor experiences for each metric, not just the 75th percentile
- Diagnostic metrics like Time To First Byte and First Contentful Paint alongside the Core Web Vitals, plus a breakdown of where LCP time goes for image-heavy pages
Use it when a Core Web Vitals report says you’re failing and you want to see exactly when it started, which device is the problem, or whether a fix is moving the numbers in the right direction.
5. Google PageSpeed Insights
PageSpeed Insights is Google’s own test and it shows two things on one page: your real visitor Core Web Vitals from CrUX at the top (when there’s enough data), and a Lighthouse lab test below with the familiar score out of 100.
It’s worth knowing that a large number of speed test tools are simply a wrapper for PageSpeed Insights or Lighthouse. They run the same Google engine, give you the same score and the same list of recommendations, and put their own branding around it. If two tools give you nearly identical advice, that’s usually why.
A few tips for reading PageSpeed Insights:
- Look at the real visitor section first. That’s the part Google uses for ranking. The score out of 100 is not.
- The mobile test simulates a mid-range phone on a slow mobile connection, so mobile scores are always lower than desktop. That’s normal.
- The lab test runs from Google’s servers, not from your customers’ country, so it can’t tell you how your site loads in Australia or the UK.
- Treat the recommendations as ideas, not orders. Some, like removing unused CSS or JavaScript, can be very hard to act on in WordPress and make little difference to real visitors.
6. Cloudflare real user monitoring (RUM)
If your site runs through Cloudflare, you can turn on its free real user monitoring, part of Cloudflare Web Analytics. It adds a small script that measures Core Web Vitals from your real visitors (LCP, INP and CLS) and shows the results in your Cloudflare dashboard.
Like CrUX, this is real visitor data rather than a lab test, but there are two useful differences:
- It collects data from your own visitors regardless of how much traffic you have, so it works for smaller sites that don’t show up in CrUX.
- Its Debug View lists the page elements doing the most damage to each metric, such as the image behind a slow LCP or the block causing a layout shift.
You’ll find it in the Cloudflare dashboard under Web Analytics, or in the Observatory section of the Speed tab. For sites proxied through Cloudflare the tracking script is added automatically, so there’s nothing to edit in WordPress. It’s free on every Cloudflare plan.
7. Vital Signs Tracker: Core Web Vitals monitoring for every page
CrUX and Search Console give you a 28-day rolling average, which means a problem can be costing you visitors for weeks before it shows up. They also only report on pages Google has enough data for, so carts, checkouts and account pages are often invisible.
Vital Signs Tracker fixes that. It collects the same Core Web Vitals Google uses, directly from your visitors’ browsers, and reports on them daily, page by page. You can break the data down by country, device, traffic source and logged-in versus logged-out visitors, which is where WooCommerce and membership sites usually hide their slowest pages.
It also tells you why a metric is slow. LCP is split into server time, resource load time and render delay, INP shows which interaction was slow and on which element, and CLS names the element that shifted. That turns “the site feels slow” into a clear job for your developer.
Setup is a small tracking script in your site footer. Plans start at US$29 a month for one site, and scheduled email reports are included, so you can see the effect of every change within a day or two instead of waiting a month.
8. GTmetrix and Pingdom (the older tools)
You’ll see GTmetrix and Pingdom recommended in a lot of older guides. They still work, but they’re less useful than they used to be:
- GTmetrix loads your page in Chrome and scores it with Lighthouse, with a helpful waterfall and video playback. It’s still handy for troubleshooting, but it now needs an account, the old free plan has been replaced by a trial and paid plans, and the headline grade is a lab score rather than real visitor data.
- Pingdom‘s free speed test is the more dated of the two. It reports load time, page size and a performance grade, and doesn’t measure Core Web Vitals at all. A good Pingdom grade tells you very little about how Google sees your site.
Neither is wrong to use, but don’t make decisions based on their scores. Check the result against real visitor Core Web Vitals.
Which test should you use?
- Quick check or troubleshooting: our free WordPress speed test, tested from the location nearest your customers.
- Are we passing Google’s test?: the free Core Web Vitals report for a quick answer, Google Search Console to see which groups of pages are failing.
- Digging into a failing metric: CrUX Vis, then PageSpeed Insights for page-level detail.
- Ongoing monitoring of every page: Vital Signs Tracker, or Cloudflare RUM if you’re on Cloudflare.
Whatever you use, test more than once, test your important pages (not just the homepage), and judge success by real visitor data.
If your tests point at the server
A slow Time To First Byte (much over 0.6 seconds) usually means the server is working too hard to build each page. Before changing plugins, check that page caching is switched on, that Redis object caching is enabled for dynamic sites like WooCommerce, and that you’re running a current PHP version. On WP Alpha hosting you can also serve static files straight from Nginx for an extra boost.
Hosting built for fast WordPress sites
WP Alpha plans include server-level caching, Redis object caching and current PHP versions, with WordPress specialists on 24/7 live chat when a speed test turns up something you’re not sure about.
Moving from another host? We’ll migrate your site for free.
View WP Alpha Plans →